Data is invaluable in today’s day and age. With machine learning and deep learning being on the forefront of technological innovation, data is the fuel that drives this innovation. With data being generated at every click, the ways in which data is processed to achieve data maturity are also increasing. In fact, the field of data science umbrella continues to broaden in its scope every year. There are scores of data handling tools in the market, each serving a variety of purposes from data storage, collection, and processing to data engineering and data mining. These tools process data for various needs, from predictive and preventive analytics to data mining i.e., finding patterns in massive quantities of data.
Businesses, like humans on the internet, also produce data with every click, transaction, and customer interaction. Due to the present-day technological advancement and heightened customer demands, businesses have had to inherently embrace data-driven strategies as a prerequisite for not only survival but also thriving in a competitive landscape. Interestingly, data analytics enables businesses to make decisions 5x quicker.
However, analytics is just one, albeit major, aspect of data. Businesses that understand the importance of data now have entire teams dedicated to processing and utilizing data for driving strategies and business forecasting.
Are Power BI and Microsoft Fabric Alternatives?
Microsoft provides several tools for processing data that help businesses refine and safely store their organizational data. Most common of them are Power BI and the newly released Microsoft Fabric. Since both tools exclusively deal with data, they are often mistaken as alternatives. Especially with Microsoft recently renaming the Power BI administrator as Fabric administrator, both tools are often mistaken to be synonymous, even though they are not.

If you are a business professional looking to choose a data processing tool but are confused between Microsoft Fabric or Power BI, do not be confused. This blog aims to break down both tools, down to their core architecture and compare them side by side to help you choose the tool best suited to your organizational needs.
Metaphorically, if Microsoft Fabric was an entire factory, then Power BI would just be a single area inside it. Let us delve deep into the functionality, purpose, architecture, and other aspects of both Microsoft tools.
Overview and Purpose
The newly released Microsoft Fabric is an AI-powered end-to-end solution for all kinds of major data processing needs. It efficiently combines all data technologies, some of which were already provided by Microsoft under Azure. Fabric unifies all the organizational data and stores it in an open format so that the same data can be used for data visualization, training machine learning models, and running SQL queries. Built on the foundation of Software-as-a-Service (SaaS), Fabric empowers an organization to let its various teams collaborate on the organizational data, stored in OneLake. Fabric offers all kinds of data functionalities to teams from data storage to data engineering and even analytics. Its foundation as a SaaS extends its simplicity and ease of use.
Fabric’s purpose is to unify all organizational data and enable all teams to access, use and even experiment with data. Unifying data under the umbrella of Fabric eradicates the need for separate and disparate data tools which create massive data siloes. Disparate data tools also restrict other teams from implementing and using data flows created by one team which limits organizational productivity. Microsoft Fabric empowers teams by providing tools and functionalities like data factory, data warehouse, data engineering, data activator, Power BI, and more.
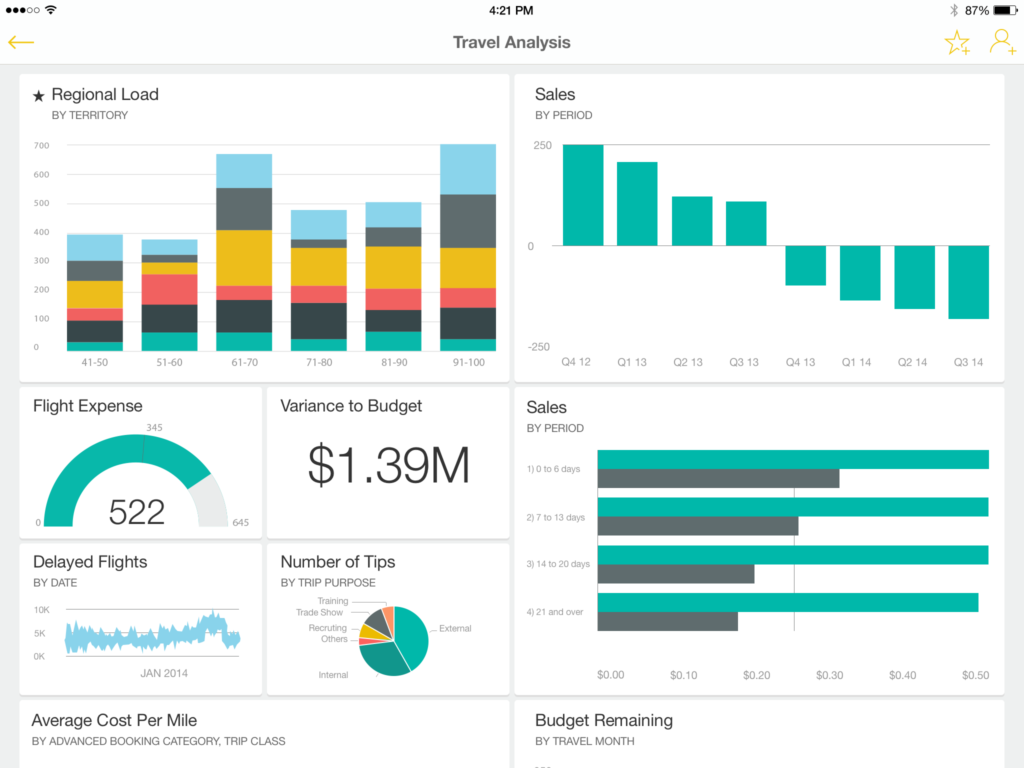
On the other hand, Microsoft Power BI is a business intelligence tool offered by Microsoft under the Power Platform. It is an AI-powered tool that enables businesses to seamlessly visualize their data through interactive reports and insights. It combines various data sources and integrates them together for insights and analysis, through its built-in connectors.
Its purpose is to turn raw data into actionable insights that empower businesses to drive strategies and decisions which are inherently data-driven. It enables users to turn their data-heavy excel sheets and other documents into interactive graphs, which helps the team better understand their data.

Capabilities and Components
Microsoft Fabric offers a plethora of data capabilities and empowers teams to cater to all data handling needs in one place. It offers the following capabilities, majorly:
- It allows organizations to unify their entire organizational data in data lakehouse i.e., OneLake.
- Users can develop ML models and train them on organizational data for process automation, inside Fabric.
- It allows real-time processing and analysis of data.
- It automates tasks like data movement and data transformation.
- It provides generative AI, through Copilot, to carry out data flows.
- It makes data less complex and more manageable, by storing it in one place and in an open Delta Lake format.
- It provides shared experiences for teams by allowing seamless collaboration on data and workflows.
- It effectively centralizes all data governance processes.
Microsoft Fabric is made up of the following components:
- Data Engineering
- Data Factory
- Data Science
- Data Warehouse
- Data Activator
- Real-time Analytics
- Power BI
Power BI’s capabilities, on the other hand, allow you to:
- Integrate data from various sources like Excel, SQL Server, Azure, etc. in various file formats like Excel, pdf, JSON, CSV, and XML.
Visualize data-dense documents into interactive graphs and charts.

- Build interactive and customized dashboards from multiple reports and consolidate data.
- Allows data processing in real time, keeping users up to date with relevant information.
It constitutes of the following components:
- Power Query
- Power View
- Power Pivot
- Power Q&A
- Power Map
- Power BI application and desktop
Architecture
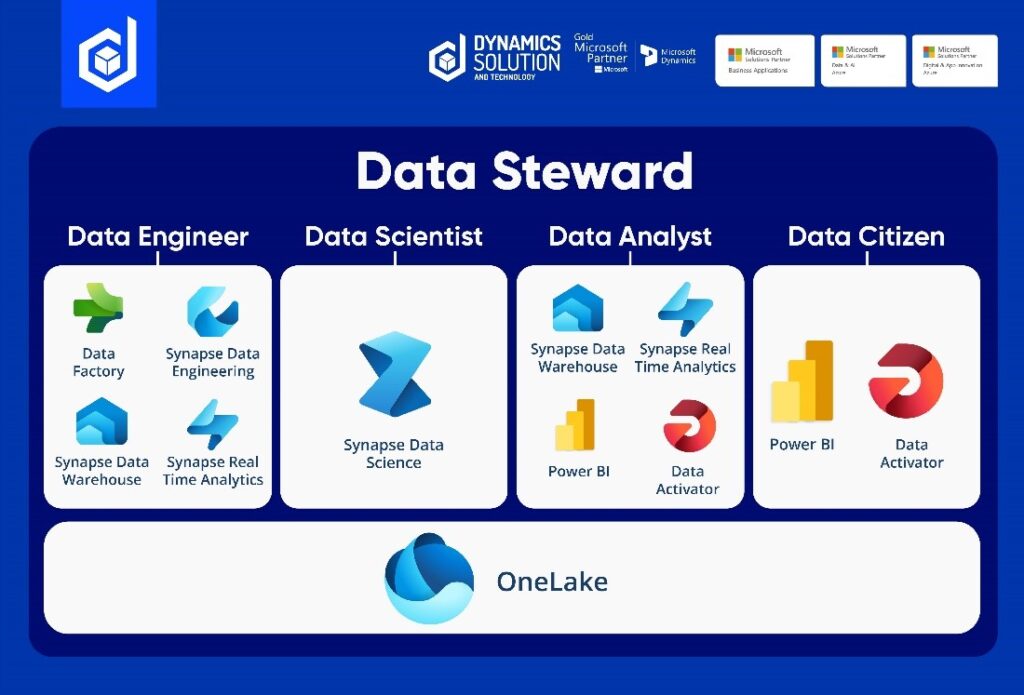
Microsoft Fabric’s essential architectural component is the OneLake, which acts as a storage layer. It supports the following workloads inside Fabric. Note that majorly the components inside Fabric also make up its core architecture.
- Data Factory
- Synapse Real-time Analytics
- Synapse Data Engineering
- Synapse Data Warehouse
- Synapse Data Science
- Power BI
- Data Activator
Power BI has a robust architecture that proves to be a solid foundation for Power BI seamlessly integrating and analyzing data. Power BI is built on Azure and Microsoft’s Power Platform. Its architecture has the following key components:
- Power BI Gateway which bridges the gap between Power BI’s cloud service and its on-prem data sources.
- Power BI Visuals constitute of graphical elements that visually depict data in an easy-to-understand manner with the help of graphs and charts.
- Power BI Report Server serves as an on-prem solution for publishing reports.
- Data Analysis Expression is the library of functions that allow users to build formulas inside Power BI.
- Power Pivot acts as an inherent component for data modeling in Power BI.
Use Cases and End Users
Microsoft Fabric, due to its unified data capabilities, provides many use cases to a variety of personas in an organization.
- It offers Data Warehousing capabilities which allow businesses to manage, analyze, and collaborate over data stored in open formats.
- Users can use Fabric for Data Integration through Power Query and Azure Data Factory
- Teams can automate their workflows by using Machine Learning and Data Science capabilities.
- Organizations can drive predictive and prescriptive analytics and forecast analysis to take timely decisions.
- Users can generate Business Intelligence-based reports inside Fabric, by leveraging the power of Power BI.
- Users can also enjoy end-to-end data governance and security capabilities, ensuring secure and compliant data processes.

Microsoft Fabric’s End users are teams that handle data in any capacity, data scientists, data engineers and even Data Stewards.
Power BI’s use cases are:
- Data Visualization
- Business Reporting
- Data Forecasting
Whereas the end users of Power BI are business owners, analysts, and stakeholders.
Concluding Thoughts
In conclusion, Microsoft Fabric is an extensive data-handling platform that can efficiently host all kinds of data technologies. It aims to unify the entire organizational data and allow all the teams, and personas, from Data Science to Data Engineering to work together and collaborate on each other’s workflows. Fabrics centralizes all data processing in one place.
Whereas Power BI is a tool for data visualizing and business intelligence reporting, that is also available inside Microsoft Fabric. It oversees just a single aspect i.e., business intelligence whereas Fabric oversees multiple aspects like Data Engineering, Data science, Data warehousing, Data Governance, and Data Analysis.
Expedite Data Processing with Dynamics Solution and Technology
Data is a massive concept, and processing it into useful information requires the right tools and the right team. Your business is generating data with every action, and it is imperative to expertly handle that data into driving successful insights and processes. However, analyzing your own data needs based on the scale of your business and selecting a proper tool or solution for it can be daunting if this is your first encounter with digitally enhancing your business.
Our expert team of consultants and technical resources are present to analyze your needs and recommend to you the best solution from Microsoft’s suite of sophisticated solutions. As Microsoft’s Gold and Solutions partner, we have an extended range of digitally transformed clientele in the Gulf, MENA, and European regions. Our unwavering dedication to providing top notch and innovative solutions is what sets us apart.
Contact us now to learn more about which data solutions are more suitable for your business needs and get on track to upscaling your decision-making and profitability today!


