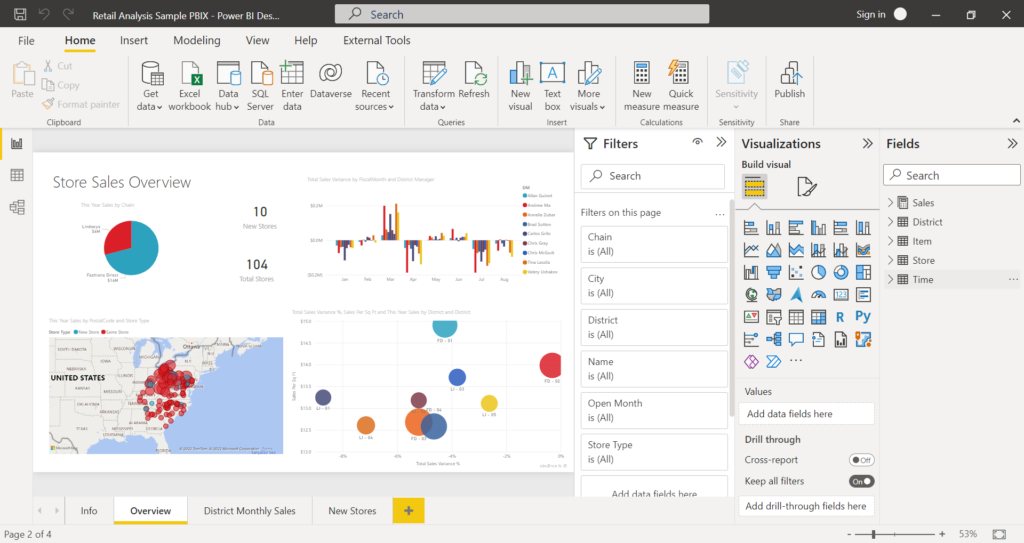
Organizations of the world today are increasingly inclined towards reliable business solutions. Essential for making informed business decisions, data visualization and analytic tools display the processed information that highlights the trends and outliers.
The breakthrough of Power BI has revolutionized data visualization, but imagine taking it further with the power of ChatGPT. This AI language model can answer your questions, explain data, and generate visualizations in natural language, making data exploration more accessible and insightful than ever before.
ChatGPT in Power BI: A Conversation with Your Data
Say goodbye to static dashboards! Ask questions like “What were last quarter’s sales?” or “Which products grew the fastest?” ChatGPT understands your intent and provides immediate, conversational responses. It’s like having a personal data assistant at your fingertips.

The integration of ChatGPT with Power BI offers several benefits, including natural language interaction, enhanced user experience, flexible analysis, democratized data access, instant insights, and contextualized recommendations. With natural language interaction, users can ask questions in everyday language, eliminating the need for complex queries or filters. This simplifies the data exploration process and makes it accessible to a wider audience. The enhanced user experience further allows users to converse with their data dynamically, making it more engaging and easier to comprehend.
Additionally, the flexibility of the system enables users to ask follow-up questions, refine inquiries, and uncover hidden patterns incrementally, promoting agile analysis. Moreover, democratized data access ensures that even non-technical users can understand and analyze data, fostering data-driven decision-making across the organization.
Instant insights provides users with immediate answers and visualizations, saving time and enhancing efficiency in report creation. Lastly, contextualized insights tailor responses to users’ specific questions and data context, offering personalized recommendations for more informed decision-making.
With that, here is a look at some of the ways in which these conversational analytics work:
Interactive Exploration
Interactive Exploration within the system enables users to engage with their data in a conversational manner, transforming the data analysis process. Rather than passively reviewing static reports, users can actively interact with the system by asking questions and receiving immediate responses. This dynamic interaction allows users to gain instant insights into their data, fostering a deeper understanding of underlying patterns and trends. For example, users can inquire about trends, anomalies, or correlations within the data, facilitating a more comprehensive analysis.
Additionally, Interactive Exploration empowers users to delve deeper into specific aspects of the data, enabling them to uncover more detailed information or explore areas of interest in greater depth. This functionality enhances the user experience and facilitates more thorough and insightful data exploration.
Dynamic Visualizations
Dynamic Visualizations within the system empower users to request specific charts or graphs effortlessly, eliminating the need to create them from scratch or rely on pre-made templates. This functionality streamlines the process of visualizing data, enhancing flexibility and efficiency in data exploration. For instance, users can simply ask for a bar chart illustrating sales by region or a line graph depicting revenue trends over time, and the system will promptly generate the visualization.
This capability not only accelerates the exploration of data but also enables users to communicate their findings effectively. By providing immediate access to tailored visualizations, Dynamic Visualizations enhance the user experience and facilitate clearer presentation of insights gleaned from the data.
Empowering Everyone with Conversational Data Culture
The integration of ChatGPT with Power BI democratizes data access within a company, making it accessible to all, regardless of their technical proficiency. This inclusivity ensures that everyone can effectively analyze data and grasp its significance, promoting a more informed decision-making culture based on evidence and insights rather than conjecture. By empowering every team member with access to data, collaboration within the organization becomes more effective, fostering innovation and ultimately contributing to the company’s success. This inclusive approach to data utilization enhances teamwork and encourages a culture where data-driven insights drive strategic initiatives and business growth.
Dynamics Solution and Technology: Empowering Businesses with Data Analytics
This amalgamation of ChatGPT and Power BI is bringing a whole new level of understanding and teamwork to how businesses use data. It makes data easier to access, encourages people to work together, and helps companies make strategic moves more quickly and effectively.
Dynamics Solution and Technology, a Microsoft Gold Partner, seamlessly implements Microsoft’s products and solutions in your business landscape for improved work functionalities. Our extended range of satisfied clienteles across the globe, especially in GULF, Mena and European regions is a testament to our dedication to excellence in the realm of digitizing businesses like Microsoft’s Solutions and Gold Partners.
Contact us today and begin your journey of upscaling your business with the endless possibilities of low-code developmental tools and conversational analytics.


